
How many homes sell in Friuli, town by town
Across the region 17,922 homes were sold in 2025, up 5.7% on 2024. Yet 145 of the 215 municipalities recorded 50 sales or fewer: outside the cities, the market runs in dozens, not hundreds.
Published 29 October 2026
Where most homes sell: the cities and the coast
The figures are from the OMI observatory of the Agenzia delle Entrate, Italy's revenue agency. Each deed is weighted by the share sold, so half a house counts as half a sale.
| # | Municipality | Zone | Homes sold in 2025 |
|---|---|---|---|
| 1 | Trieste | Trieste and the Karst | 3,585 |
| 2 | Udine | Udine and its ring of towns | 1,726 |
| 3 | Pordenone | Pordenone and the western plain | 827 |
| 4 | Lignano Sabbiadoro | Lignano, Latisana and Marano | 657 |
| 5 | Gorizia | Collio, Gorizia and the Isonzo | 591 |
| 6 | Monfalcone | Monfalcone and the Bisiacaria | 460 |
| 7 | Grado | Grado and Aquileia | 326 |
| 8 | Sacile | Pordenone and the western plain | 276 |
| 9 | Latisana | Lignano, Latisana and Marano | 215 |
| 10 | Aviano | The Pordenone foothills and Piancavallo | 198 |
The four provincial capitals account for 6,729 sales, over a third of the total; Trieste alone makes up 90% of its province. Then comes the seaside: Lignano Sabbiadoro, with 6,888 residents, sells more homes than Gorizia, a city of 33,620.
Village Friuli: dozens of sales, not hundreds
On its 2025 map the agency places 145 of the 215 municipalities between 1 and 50 sales, 37 between 50 and 100 and 24 between 100 and 200; the smallest, it notes, lie mostly in the mountains, hills and foothills. Where a town's own figure is missing, the report often gives a ceiling:
- Carnia, 28 municipalities: apart from Tolmezzo, Sappada, Arta Terme, Forni di Sopra, Ravascletto and Paluzza, none exceeds 24 sales.
- Pedemontana: Bordano, Lusevera, Montenars, Taipana and Venzone stay at 21 or below.
- Canal del Ferro and Val Canale: beyond Tarvisio, Chiusaforte, Malborghetto, Moggio and Pontebba, none goes above 6.
At these volumes percentages jump: Trasaghis doubled to 32 sales, Sgonico fell to 16 (-23.8%). In a village, such a swing is a handful of deeds, not a trend.
How many homes in a hundred change hands
To set a village beside a city, the agency uses the IMI, or market intensity: the share of existing homes sold during the year. The region stands at 2.4%, Udine at 3.0%.
| # | Municipality | Zone | Sales per 100 homes |
|---|---|---|---|
| 1 | Chiopris-Viscone | Central Friuli and Palmanova | 4.2% |
| 2 | Montenars | Gemona, Venzone and Lake Cavazzo | 4.1% |
| 3 | Tarvisio | Tarvisio, Canal del Ferro and Val Resia | 3.6% |
| 4 | Aiello del Friuli | Lower Friulian plain | 3.2% |
| 5 | Ravascletto | Carnia and Sappada | 3.2% |
| 6 | Campolongo Tapogliano | Lower Friulian plain | 3.2% |
| 7 | Treppo Grande | Moraine hills and San Daniele | 3.2% |
| 8 | Mortegliano | Central Friuli and Palmanova | 3.1% |
| 9 | Palazzolo dello Stella | Lower Friulian plain | 3.0% |
| 10 | Pasian di Prato | Udine and its ring of towns | 3.0% |
Leading the table are towns of the plain and the hills, Montenars in the Pedemontana, and Tarvisio and Ravascletto in the mountains. But Chiopris-Viscone has 703 inhabitants and Montenars 498: a few sales are enough to rank high. Where a figure is published, the median is 2.1% in the mountains (31 of them) and 2.4% across the hills and plain (68).
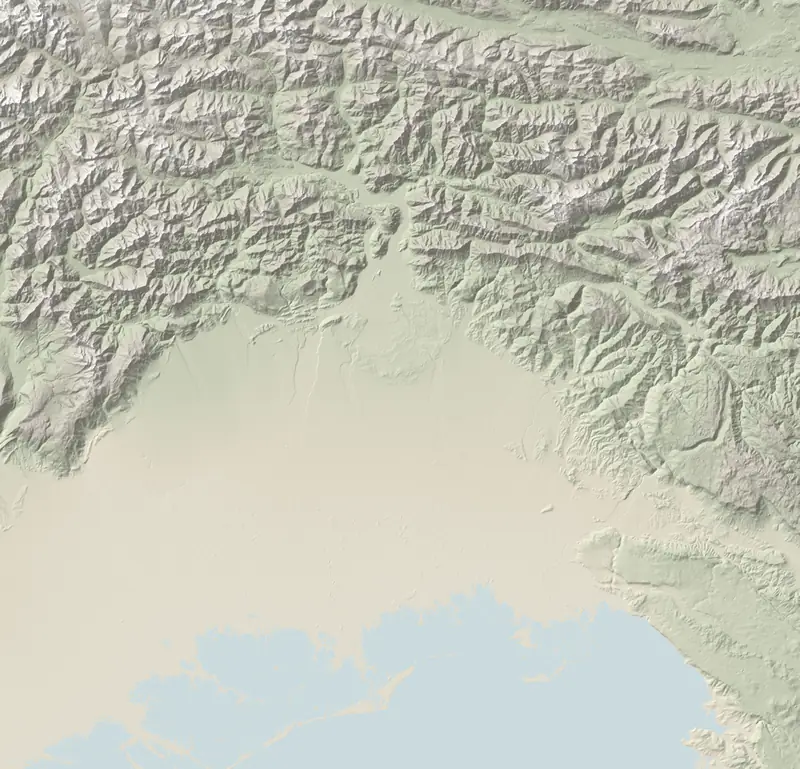
White dots mark municipalities with no published IMI.
Where sales are growing, and where they are not
OMI districts group neighbouring, similar municipalities, including those without a figure of their own. In 2025 sales grew most away from the sea:
- Pedemontana (Gemona, Venzone, Bordano): +35%, 256 sales;
- Pordenone valleys, from the Valcellina to the Val d'Arzino: +27%, from 125 to 160;
- Natisone valleys and Cividale +21%, Destra Isonzo (right bank of the Isonzo) +21%;
- Udine's suburbs +15%, Canal del Ferro and Val Canale +15%.
The established markets stood still or slipped: Monfalcone and the Sinistra Isonzo -0.3%, the furniture district around Sacile -0.2%, Grado -4.7%. And more sales do not mean higher prices: in the Pedemontana the average value barely moved (how prices are moving).
If your town is not on the list
The agency counts sales in all 215 municipalities, but prints the figure only for those it names in its regional report: 94, and 109 for the IMI. Its open files stop at provinces and provincial capitals. Town-level data is free on request with a login, but excludes the 43 municipalities under the land register (tavolare) system: all of the Trieste and Gorizia provinces and part of Udine's. There, the regional report is the only public number.
The list also leans towards busy markets: of the 15 municipalities where more than 3% of homes changed owner, the report names 11; of the 11 below 1%, only Erto e Casso. If your town is missing, look at its district instead.
What it means for owners and for buyers
Selling. Many sales mean a liquid market: more buyers about and more recent deals to measure a price against. With a few dozen a year the reverse holds: the right buyer has to be sought further afield, abroad included (who buys from outside); comparisons are scarce and the OMI range can sit unchanged for years (values town by town), so the house itself has to justify the price.
Buying. Where little sells, there are few recent prices to test an asking price against, and the market will be just as thin on the day you sell. That is not a flaw of the place; it is a factor to weigh, like the price.
Questions
How many homes are sold each year in Friuli Venezia Giulia?
17,922 in 2025, a rise of 5.7% over 2024. By province: Udine 7,876, Trieste 3,968, Pordenone 3,851, Gorizia 2,227.
Which town in Friuli has the most property sales?
Trieste, with 3,585 in 2025, followed by Udine (1,726) and Pordenone (827). Outside the provincial capitals, Lignano Sabbiadoro leads with 657.
What does Italy's IMI market intensity index measure?
The share of an area's homes that changed owner in a year. In 2025 it was 2.4% in Friuli Venezia Giulia; across published municipalities it ranges from 0.8% to 4.2%.
Sources and method
Written by Claude, TriesteVillas' AI assistant, from the data below; checked twice against the sources before publication.
The figures on this page come from:
- Agenzia delle Entrate – OMI, Statistiche regionali 2026 Friuli-Venezia Giulia (dati 2025): testo e Figure 3–4 di p. 3, Tabella 2, Tabelle 14, 18 e 22 per macroarea, focus provinciale di Udine (elaborazione FriuliVillas) (data as of 2026-10-29) · CC BY 4.0, citazione obbligatoria «Agenzia delle Entrate – OMI»
- ISTAT SITUAS — comuni, caratteristiche del territorio, dimensione, aree di policy (data as of 2026-10-07) · CC BY 4.0
- Agenzia delle Entrate — OMI, Statistiche regionali Friuli Venezia Giulia 2025: compravendite (NTN) e intensità del mercato (IMI) per comune (data as of 2026-10-22) · riuso con citazione della fonte (Agenzia delle Entrate – OMI)
- Agenzia delle Entrate – OMI, Statistiche regionali 2026 Friuli-Venezia Giulia (dati 2025): Tabelle 1, 3, 4, 8 e Figura 6 (elaborazione FriuliVillas) (data as of 2026-10-22) · CC BY 4.0, citazione obbligatoria «Agenzia delle Entrate – OMI»
- Tribunale di Trieste — territori in cui vige il sistema tavolare (libro fondiario), 23/04/2026; Regione FVG, uffici tavolari (data as of 2026-10-22) · atti ufficiali
- Agenzia delle Entrate – OMI, Statistiche regionali 2026 Friuli-Venezia Giulia (2025 data) (2026-10-29)
- Agenzia delle Entrate – OMI, Volumi di compravendita: open files by province and provincial capital (2026-10-29)
- Agenzia delle Entrate – OMI, Forniture dati: sales by municipality, excluding land-register (tavolare) municipalities (2026-10-29)