
Friuli house prices: where they are rising, and where they are falling
Between 2021 and 2026 the official value of homes went up in 55 municipalities, down in 18 and stayed put in 135 out of 208. Where it moves, how far to trust it, and what it means for owners.
Published 29 October 2026
The usual story: nothing moves
Between the first halves of 2021 and 2026 the OMI, the Revenue Agency's market observatory, left values unchanged in 135 municipalities out of 208: in 10 of 10 across the Friulian Dolomites and Val Tramontina.
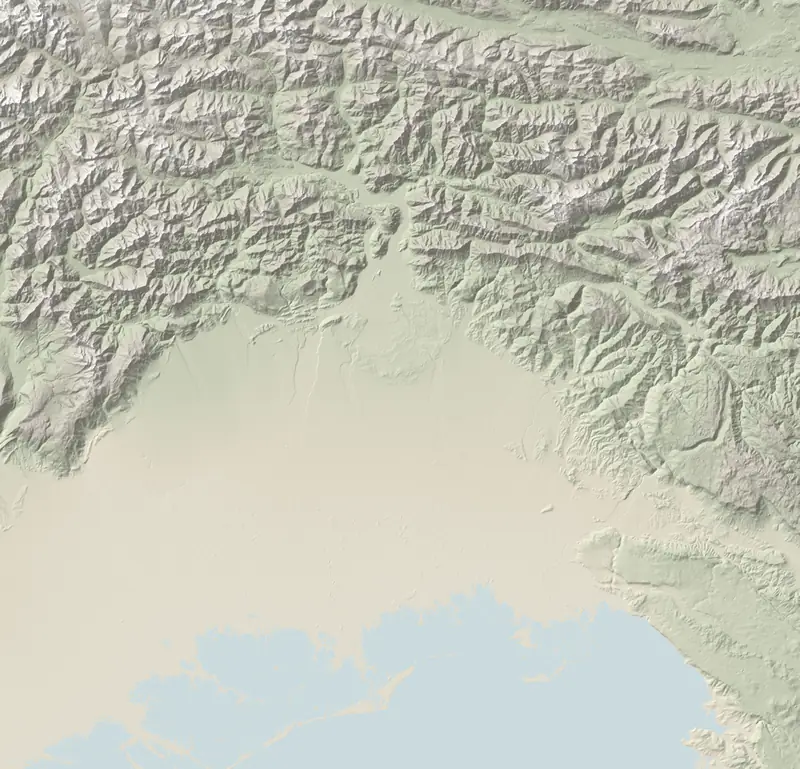
The darker the dot, the bigger the rise; the palest, the falls, line the Isonzo.
Unchanged is not frozen: the Agency surveys prices on the ground, mostly from deeds of sale, where enough homes change hands; elsewhere a range can stay put for years. And these are current euros: with inflation, a flat value loses purchasing power.
How we count. Each OMI zone is compared with itself; for the municipality we take the median of those changes. Where the Agency redrew its zones in 2024, fewer are left to compare: in 19 municipalities, Udine included, only one, so the figure is fragile. And an OMI range says little about one particular house: it covers ordinary homes in average condition (how OMI values work).
Rising: Trieste and the Karst, the Pordenone plain, Sappada and Grado
| # | Municipality | Zone | Prices over 5 years |
|---|---|---|---|
| 1 | Trieste | Trieste and the Karst | 50.0% |
| 2 | Muggia | Trieste and the Karst | 40.4% |
| 3 | Azzano Decimo | Pordenone and the western plain | 29.7% |
| 4 | Sgonico | Trieste and the Karst | 29.1% |
| 5 | Duino Aurisina | Trieste and the Karst | 28.0% |
| 6 | San Dorligo della Valle | Trieste and the Karst | 27.9% |
| 7 | Sappada | Carnia and Sappada | 27.1% |
| 8 | Martignacco | Udine and its ring of towns | 23.2% |
| 9 | Grado | Grado and Aquileia | 21.8% |
| 10 | Pasiano di Pordenone | Pordenone and the western plain | 20.0% |
Half the list lies between Trieste and the Karst, where values are still climbing: Trieste +16.7% and Muggia +14.5% in the past year alone. The region's two biggest one-year gains, Pasiano and Prata, are on the Pordenone plain, and in both that year is the whole five-year rise. Then snow and sea, Sappada and Grado, and Martignacco on the edge of Udine.
In Grado the median hides a wide spread: seven zones, from −21% in the farmland zone to +69% in Grado Pineta. The town's +21.8% is that of the old town and harbour, the middle zone.
Falling: either side of the Isonzo
| # | Municipality | Zone | Prices over 5 years |
|---|---|---|---|
| 1 | Turriaco | Monfalcone and the Bisiacaria | -12.4% |
| 2 | Romans d'Isonzo | Collio, Gorizia and the Isonzo | -9.8% |
| 3 | Mariano del Friuli | Collio, Gorizia and the Isonzo | -9.5% |
| 4 | Medea | Collio, Gorizia and the Isonzo | -9.5% |
| 5 | Moraro | Collio, Gorizia and the Isonzo | -9.5% |
| 6 | San Pier d'Isonzo | Monfalcone and the Bisiacaria | -9.5% |
| 7 | San Canzian d'Isonzo | Monfalcone and the Bisiacaria | -7.4% |
| 8 | San Lorenzo Isontino | Collio, Gorizia and the Isonzo | -6.5% |
| 9 | Cormons | Collio, Gorizia and the Isonzo | -6.3% |
The whole list lies on both banks of the Isonzo, from Cormons to Turriaco: a median of -5.5% around Collio, Gorizia and the Isonzo, -5.1% around Monfalcone and the Bisiacaria. The two towns buck the trend: Gorizia +18.5%, Monfalcone +12.7%. Outside the province of Gorizia only Ravascletto, in Carnia, has fallen (-4.5%).
In 2025 the average value of the OMI's Destra Isonzo district (the right bank) fell by 3.9%, while sales rose by 21%. Over the last year values there have edged back up in 14 of 14 municipalities, mostly by a point or two.
Sales tell a different story
OMI values say what an area is worth; sales (NTN) count how many homes change hands. The Agency publishes no table by municipality: 2025 figures exist for the 94 municipalities it names in its regional statistics, and in the land-register provinces (Trieste, Gorizia, part of Udine) they are missing even from the data it supplies on request.
| Trieste | Grado | Sappada | Tarvisio | Gemona del Friuli | |
|---|---|---|---|---|---|
| Prices over 5 years | 50.0% | 21.8% | 27.1% | 13.5% | 0.3% |
| Homes sold in 2025 | 3,585 | 326 | 75 | 187 | 113 |
| Sales per 100 homes | 2.8% | 2.6% | 2.7% | 3.6% | 2.0% |
- Flat values, more sales: Trasaghis doubled its sales (+100.0%) with the same OMI ranges as in 2021; of the 32 municipalities with unchanged values and sales data, 22 sold more homes in 2025.
- Values up, sales down: Grado -4.7%, Sappada -7.8%; Trieste sold about as many homes as the year before (+0.6%).
- Both up: Tarvisio, where 3.6% of the housing stock was sold in 2025, compared with 2.4% regionwide.
If you are the one selling
- Rising values (Trieste, the Karst, the Pordenone plain): OMI lags behind the market, because it is revised on deeds already signed; the asking price comes from nearby sales and the state of the house.
- Flat values (most of the mountains and the plain): the figure neither helps nor hurts; what counts is the house, its paperwork, its light, its minutes from services. And buyers exist: see Trasaghis and the Pedemontana.
- Falling values (along the Isonzo): buyers compare your price with today's range, not 2021's; the house must justify the gap, or talks drag on.
What buyers will ask you: ten questions, with the data.
Questions
Are property prices going up in Friuli?
In part of the region: over five years the OMI value rose in 55 municipalities, led by Trieste (50.0%) and Muggia (40.4%), then the Karst, the Pordenone plain, Sappada and Grado; in the last year, Pasiano and Prata di Pordenone.
Where are house prices falling in Friuli Venezia Giulia?
Along the Isonzo: Turriaco -12.4% over five years, Medea and Moraro -9.5%, Cormons -6.3%. Over the last year they have edged back up.
Should I sell my Friuli property now or wait?
No percentage can tell you: these figures show where an area has been, not where it is heading. Your own circumstances, mortgage, an inheritance and tax matter more; talk them through with a notary and an accountant.
Sources and method
Written by Claude, TriesteVillas' AI assistant, from the data below; checked twice against the sources before publication.
The figures on this page come from:
- Agenzia delle Entrate — Osservatorio del Mercato Immobiliare (OMI): quotazioni per zona e tipologia; valore per comune = mediana dei punti medi delle zone OMI, stato normale (data as of 2026-10-22) · riuso con citazione della fonte (Agenzia delle Entrate – OMI)
- Agenzia delle Entrate – OMI, Statistiche regionali 2026 Friuli-Venezia Giulia (dati 2025): Tabelle 1, 3, 4, 8 e Figura 6 (elaborazione FriuliVillas) (data as of 2026-10-22) · CC BY 4.0, citazione obbligatoria «Agenzia delle Entrate – OMI»
- Agenzia delle Entrate — OMI, Statistiche regionali Friuli Venezia Giulia 2025: compravendite (NTN) e intensità del mercato (IMI) per comune (data as of 2026-10-22) · riuso con citazione della fonte (Agenzia delle Entrate – OMI)